GT Interaction Maps
- Version:
2024Q3
- Date:
2024-09-10
Note
A visual representation of interactions within GT-AIMPF: This section provides insights into personnel affiliations, subgroup dynamics, and highlights on current focuses, research interests, and interdisciplinary connections.
An effective way of organizing projects is around personnel and their affiliation with subgroups, which reflects both their current focus and research interests. The following figures are interaction maps generated based on subgroup assignments and are updated periodically to reflect changes in team structures.

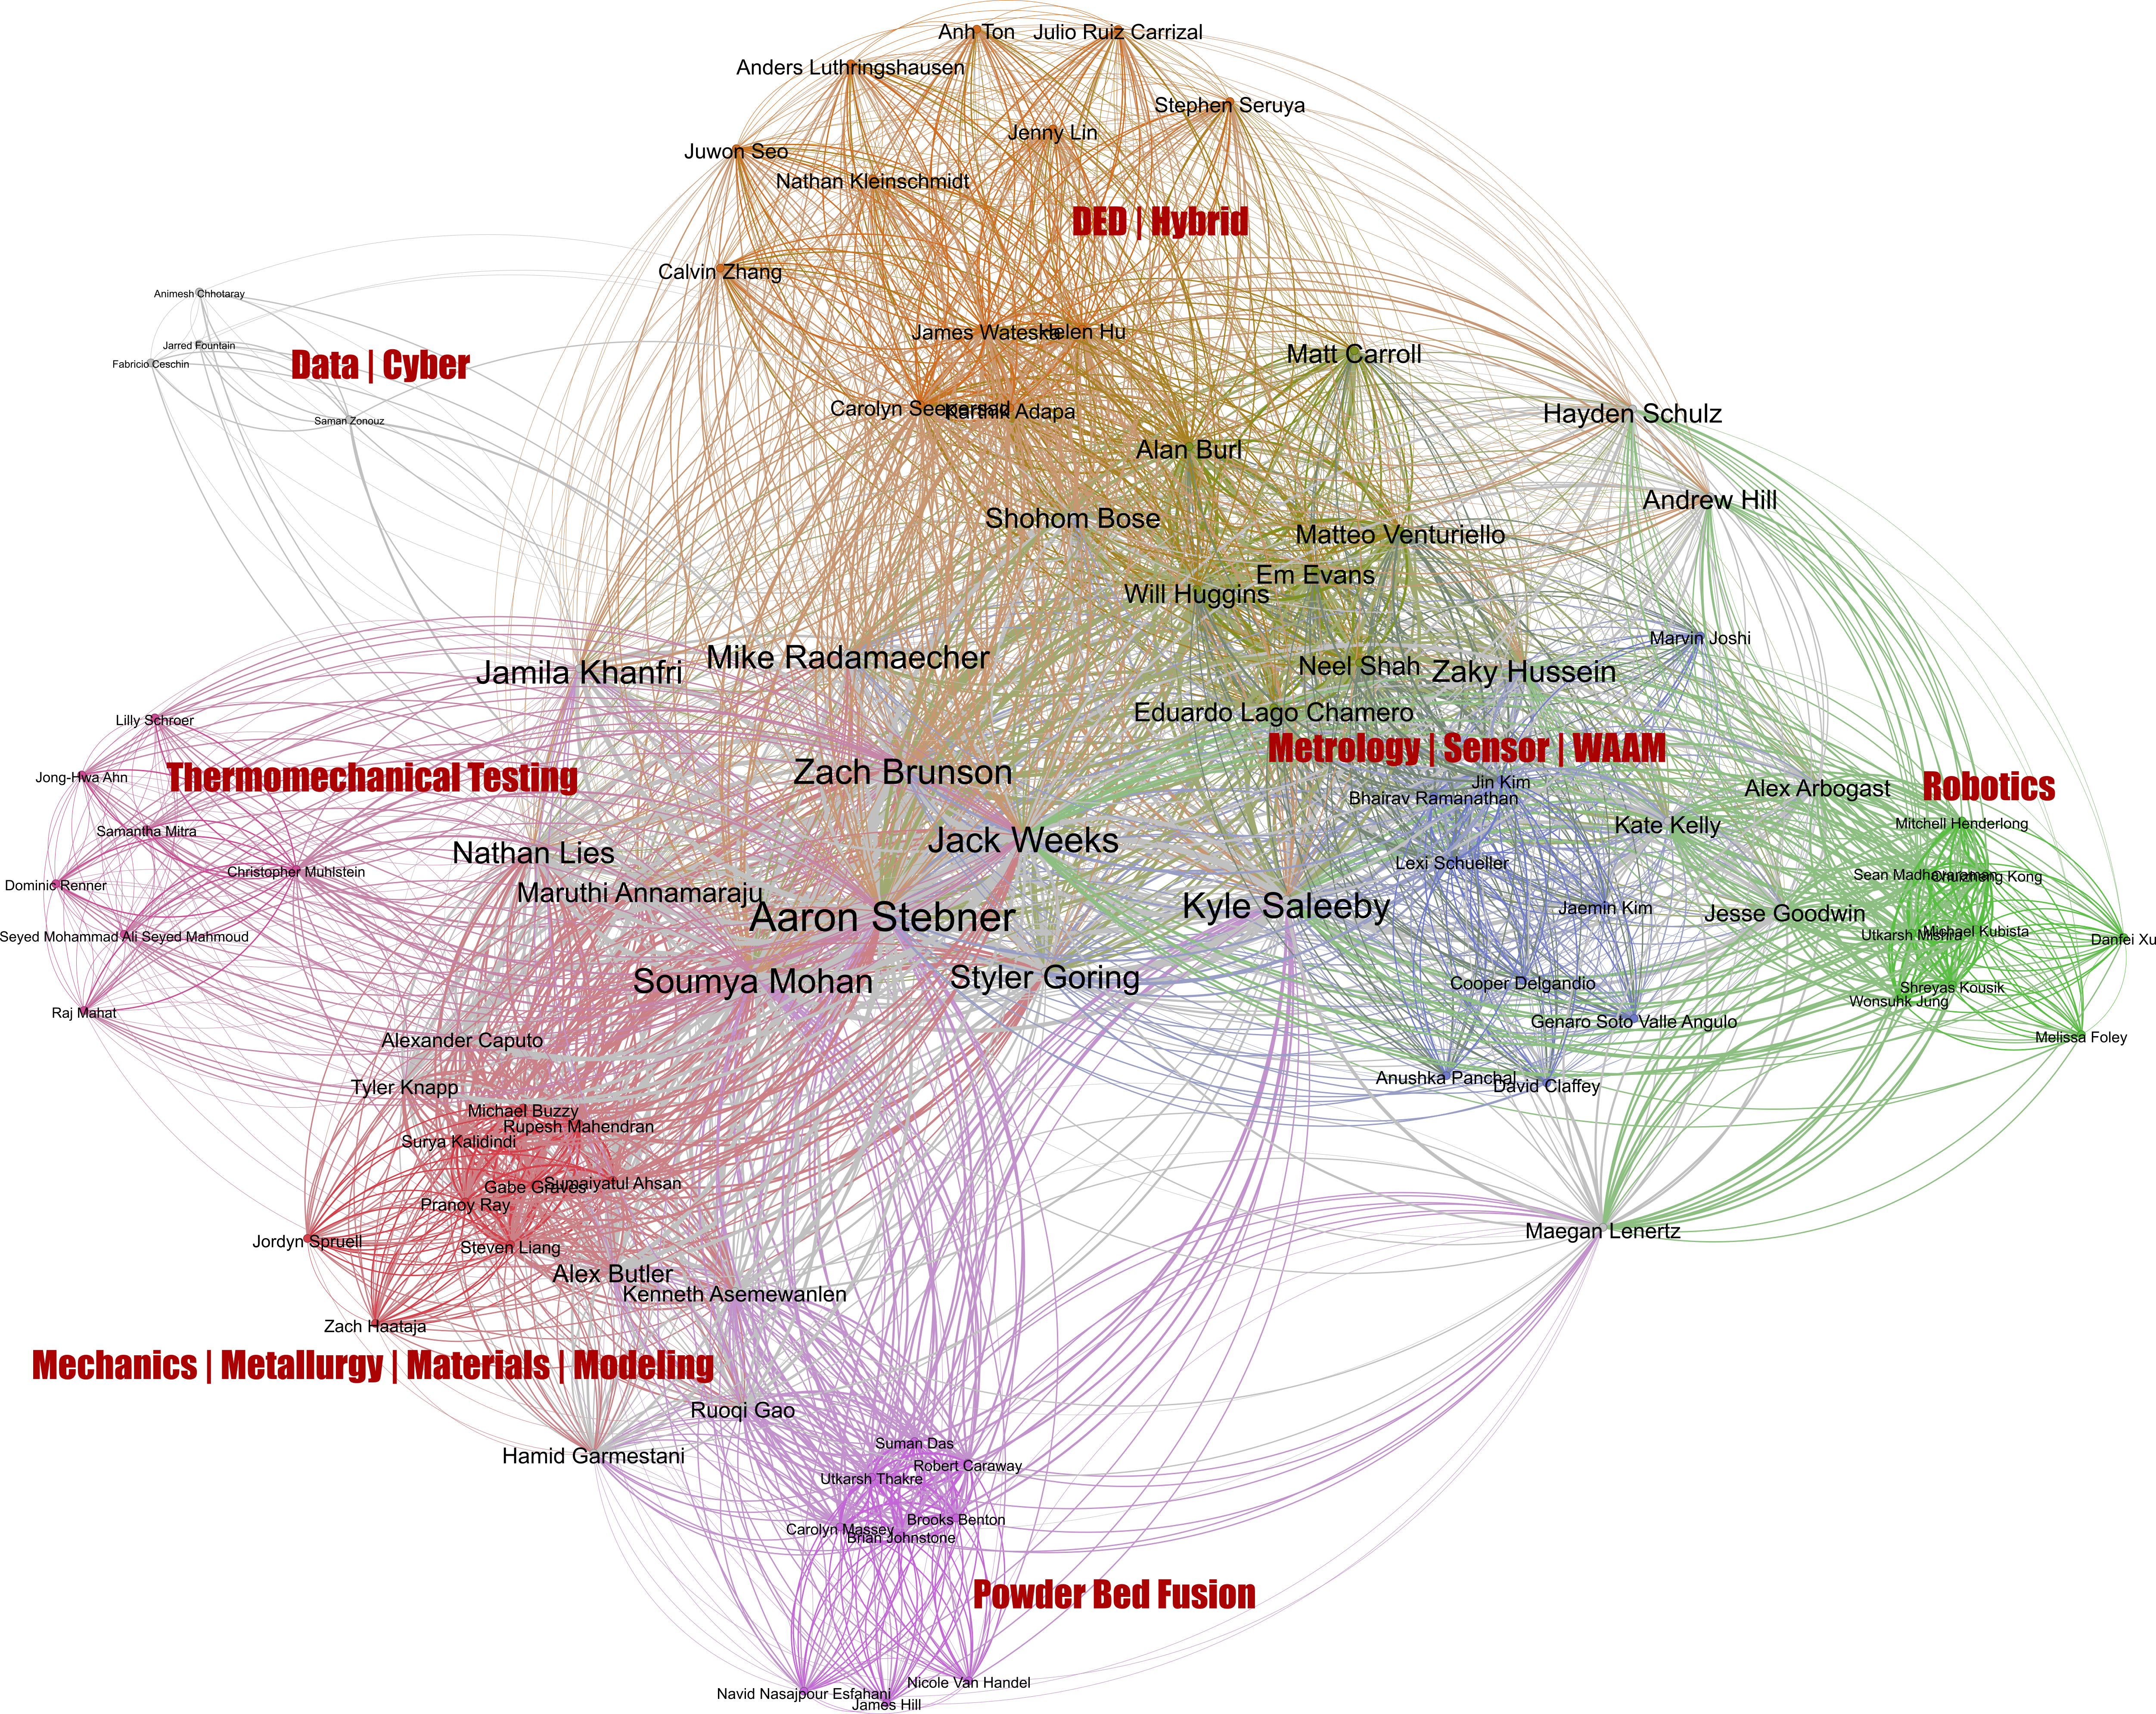
Figure 1. Interaction map illustrating connections between all researchers and subgroup affiliations within AIMPF. Edges represent shared subgroup memberships, with colors indicating graph network authority. This network structure gives an overview of collaboration clusters and cross-functional synergies within AIMPF.
In this figure, each node represents a researcher, and connections between nodes indicate shared membership within AIMPF subgroups. Colors are used to partition researchers based on network authority, helping identify those with high connectivity who may serve as collaboration hubs. The map also shows spatial clustering of researchers with similar interests, facilitating the identification of potential interdisciplinary synergies across subgroups.
The structure highlights several important observations:
Cross-functional Hubs: Certain researchers, positioned centrally within the network, serve as essential connectors between multiple subgroups. These individuals act as bridges, enabling knowledge sharing and collaborative projects across distinct research areas. Notable connection hubs include researchers in the Mechanics | Metallurgy | Materials | Modeling (M4) subgroup, who are linked to both material testing and production processes.
Isolated Groups: Some subgroups, such as Data | Cyber, are positioned on the outskirts of the network. This positioning suggests limited integration with other research groups, which could hinder effective data-driven collaboration. Enhancing connectivity for this subgroup might support improved cybersecurity measures across AIMPF’s projects.
The map demonstrates how AIMPF’s diverse talent pool can leverage shared expertise to address complex manufacturing and AI challenges.

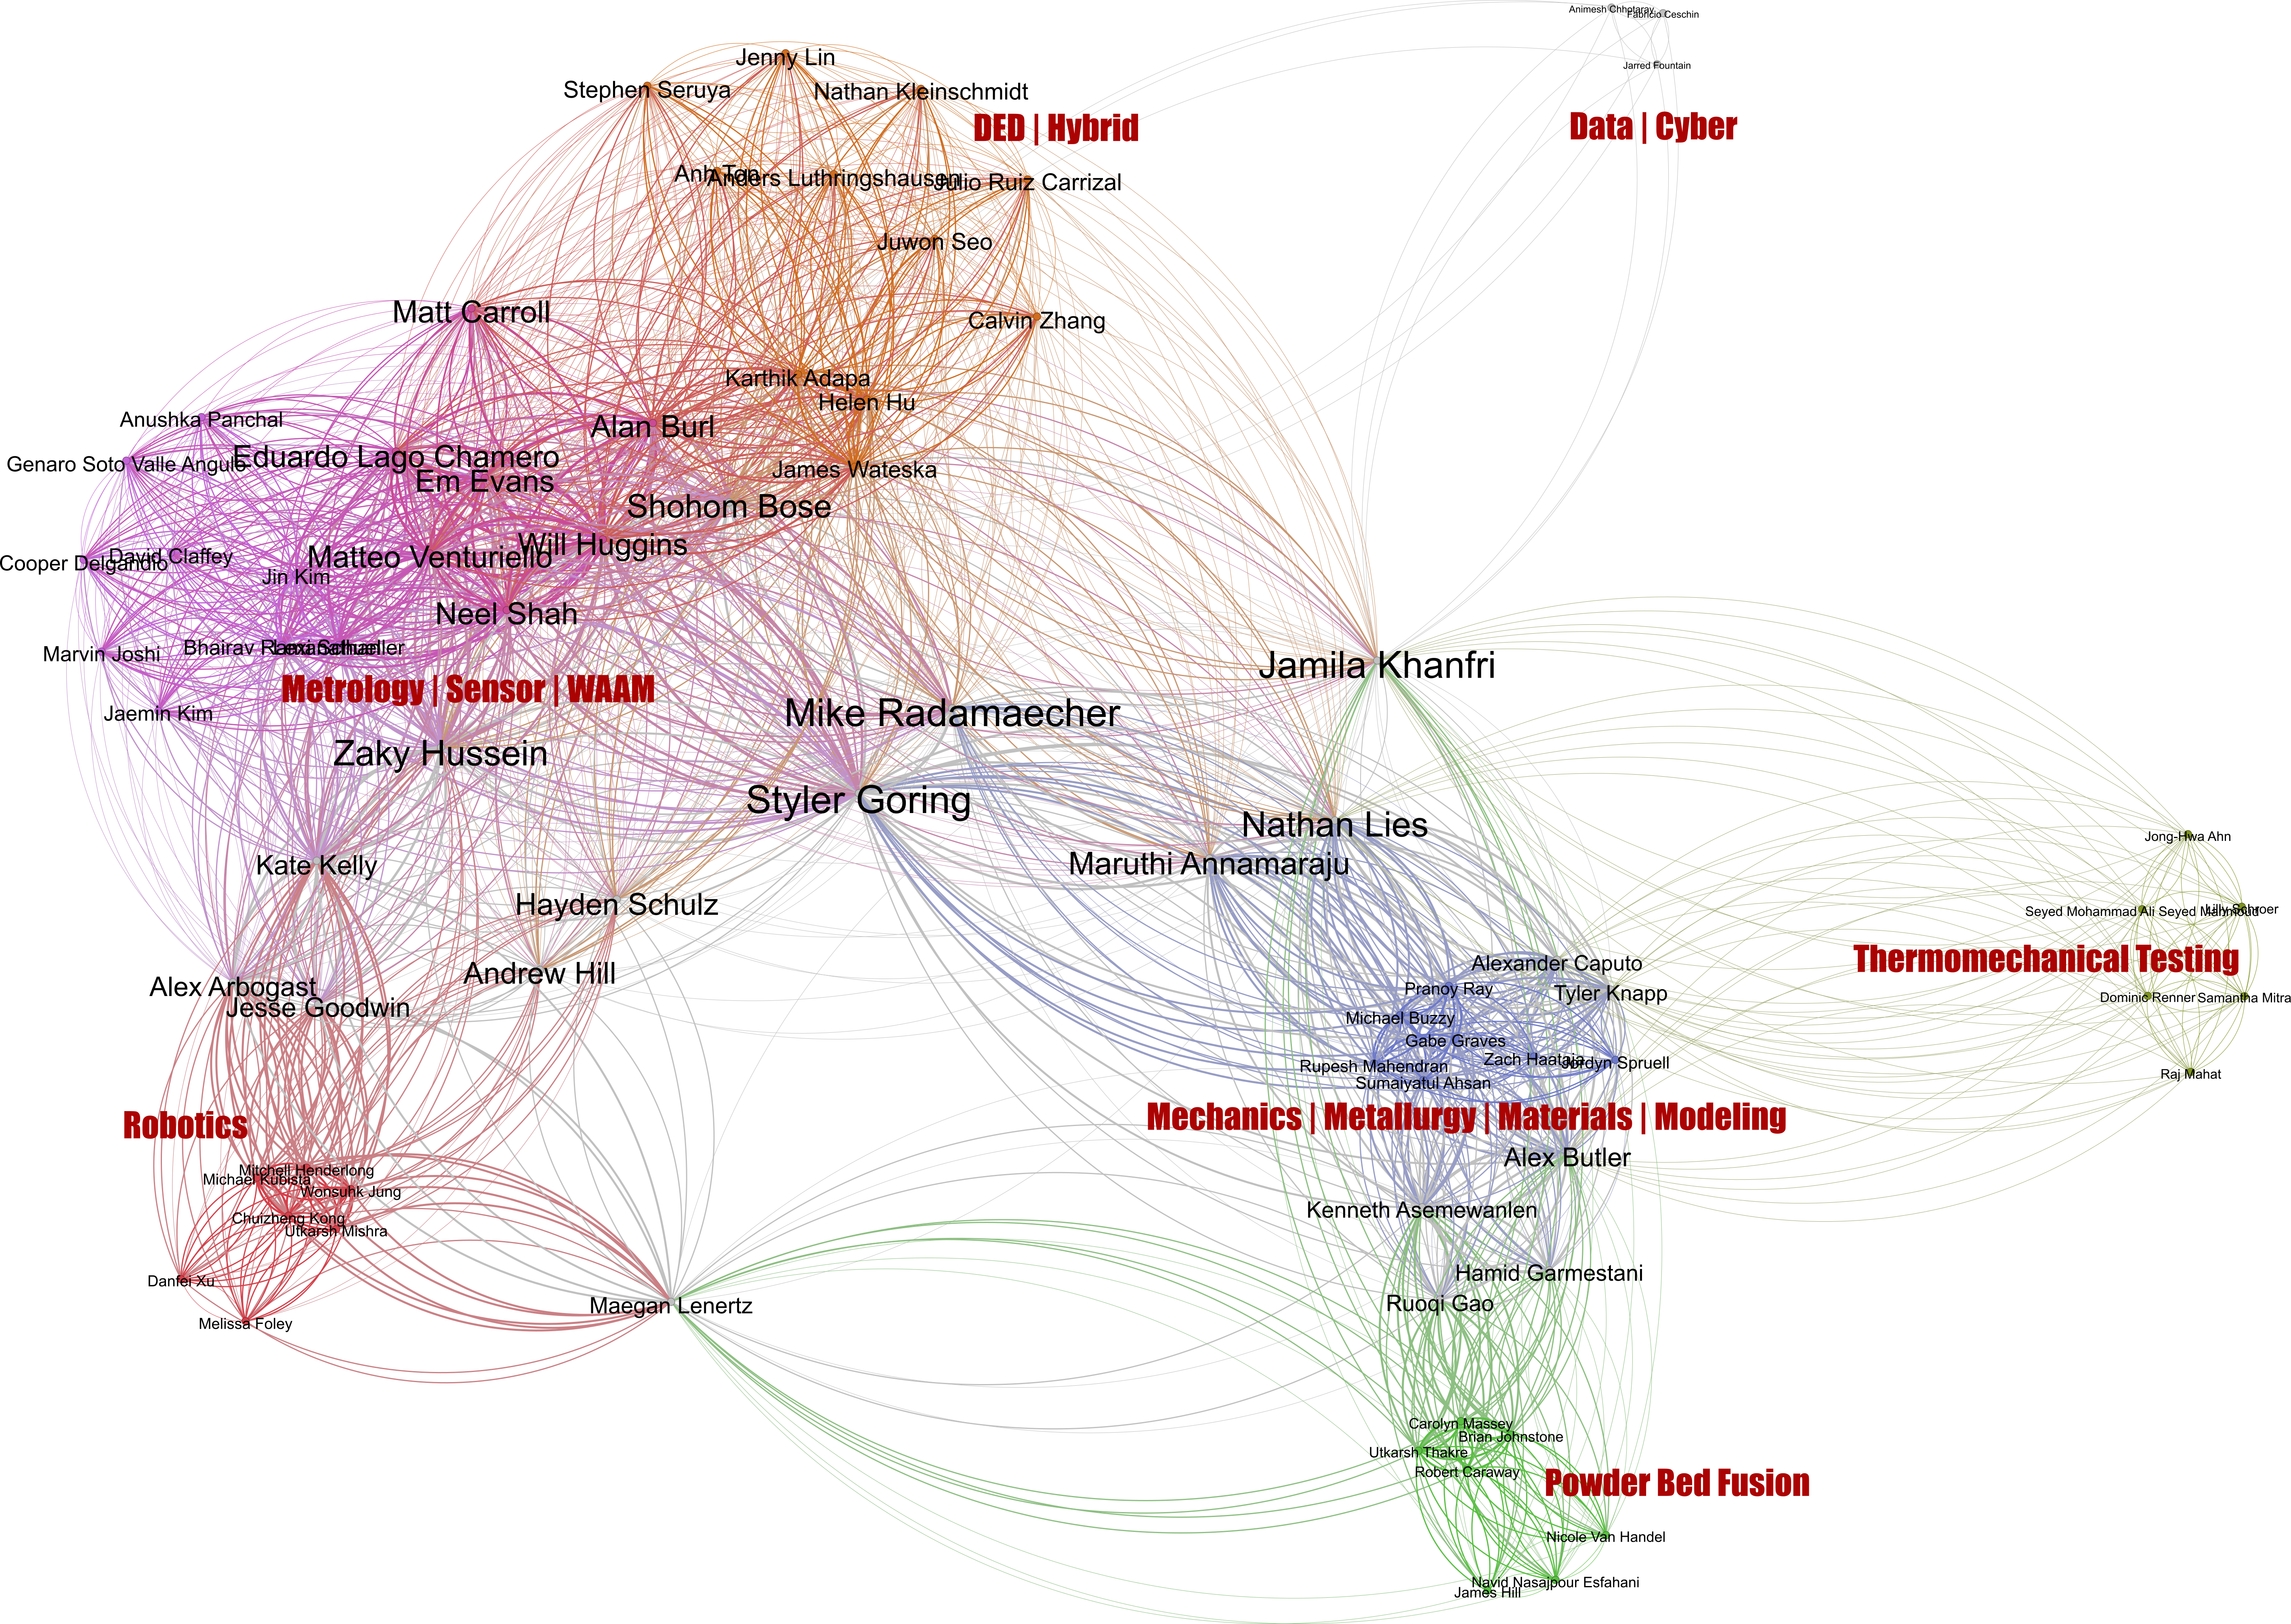
Figure 2. Interaction map focusing on primary reporters and subgroup points of contact (POCs), excluding advisors, to highlight peer-led collaboration within AIMPF. This map reveals potential pathways for student-driven collaboration across subgroups.
In this advisor-free visualization, nodes represent key contributors who actively report and participate within subgroups, with connections showing collaborations among these participants. By removing advisors, the map emphasizes student-led interactions, fostering an environment where students can drive collaboration independently.
This configuration provides insight into the following:
Collaboration Pathways: Primary reporters and subgroup POCs emerge as key nodes connecting different research areas. These individuals play a critical role in ensuring smooth information flow across AIMPF subgroups. Notably, the DED | Hybrid subgroup connects well with Metrology | Sensor | WAAM, highlighting effective cross-group integration that supports advancements in sensor technology and hybrid manufacturing.
Communication Gaps: Areas with limited connections indicate potential communication gaps. For instance, Robotics appears less connected to other groups, aside from a link to WAAM, suggesting opportunities to strengthen interdisciplinary ties and knowledge exchange, particularly in areas where automation could complement sensor and data applications.

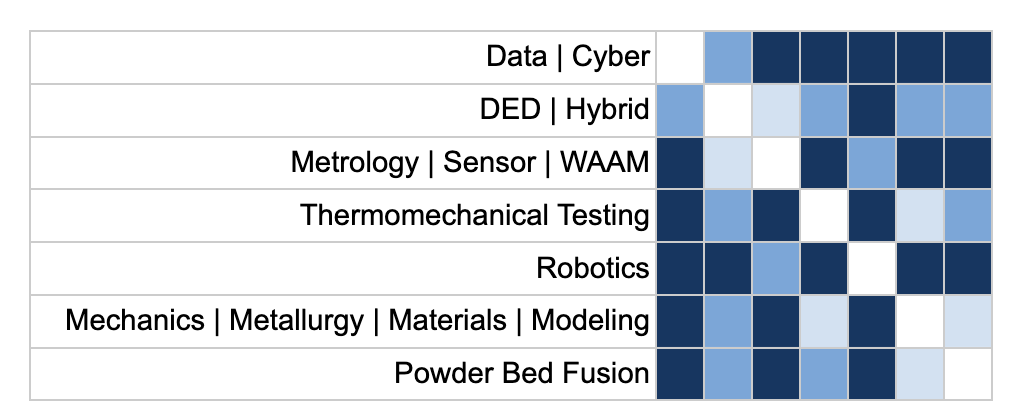
Figure 3. Qualitative connectivity map showing the strength of connections between AIMPF subgroups. Lighter colors indicate stronger connectivity; darker colors represent weaker or minimal connections between groups.
This qualitative connectivity map provides an overview of interaction levels among subgroups, highlighting areas of both strong and weak collaboration. Specific observations include:
Strong Connections: The DED | Hybrid subgroup has robust ties with Metrology | Sensor | WAAM, reflecting their shared focus on sensor technologies in advanced manufacturing. Thermomechanical Testing is also closely connected with Mechanics | Metallurgy | Materials | Modeling, showing a strong alignment in material characterization and modeling.
Weak Connections: The Robotics subgroup shows limited connections with other groups aside from WAAM. Strengthening connections between Robotics and groups like Data | Cyber could enhance AIMPF’s capabilities in automation and cybersecurity.
Isolated Subgroups: The Data | Cyber group remains relatively isolated, limiting its integration within other AIMPF groups. Integrating its members across more subgroups could help in securing data handling across AIMPF projects.
These interaction maps collectively reveal AIMPF’s strategic efforts in aligning research goals with collaboration structures. By identifying strong and weak connections, AIMPF can better allocate resources, encourage interdisciplinary work, and refine its organizational model to maximize research outcomes.